PivotTables and PivotCharts from scratch, for Microsoft Excel
PivotTables and PivotCharts from scratch, for Microsoft Excel
Couldn't load pickup availability
PivotTables aren't black magic and you don't need a uni degree to understand them. PivotTables and PivotCharts from scratch strips away the technobabble so you can make your own PivotTables and make sense of any list of numbers or information.
Plenty of step-by-step instructions and Excel worksheets you can open and try for yourself.
- Excel 365, 2024, 2021, LTSC, 2019 & 2016 for Windows
- Full Color
- 3rd edition - 2025
- over 260 pages
- 12 sample worksheets, ready for you open and try for yourself. Included with full explanation in the text.
- Fast find, table of contents with links
- PDF format compatible with Windows, Mac, Apple and Android tablets and pretty much anything else including, of course, iPads!
We don't limit ourselves to the narrow topic, as usual with Office-Watch.com books. There's useful extra coverage in this book that will help you make better PivotTables and PivotCharts.
Excel Tables, Conditional Formatting, Relationships and the Data Model are all part of the wider PivotTable world.
Why bother with Excel PivotTables?
A quick look at what PivotTables can do for you.
Your first PivotTable
Step by step to making a first PivotTable, with a finished example for you to try out for yourself.
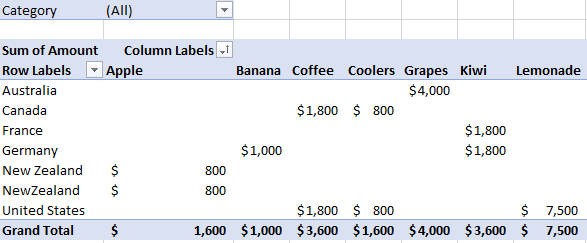
Your first Two-dimensional PivotTable
The next step is a '2D' PivotTable with more columns of info.

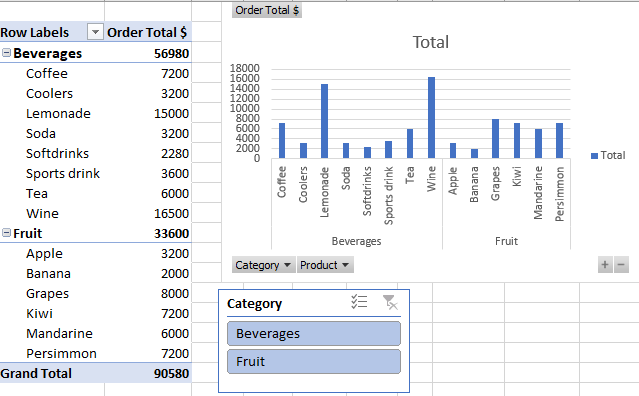
Multiple or nested rows
Beyond that are PivotTables with many rows of nested and grouped information.
Ideas for faster PivotTables/Charts
Excel 365 is getting 'Ideas', a faster way to analyse lists and quickly make relevant PivotTables and PivotCharts. New! in the 2nd edition
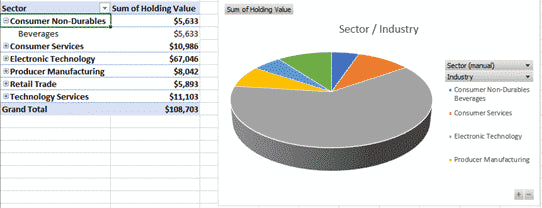
Stocks and Shares
A working example of getting the latest stock/share info into Excel then using it to analyze your portfolio.

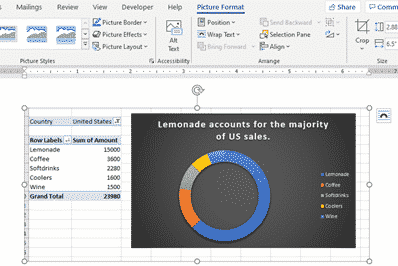
Linking to Word or PowerPoint
All the options for copying, linking or embedding a PivotTable/PivotChart into a Word document or PowerPoint slide.

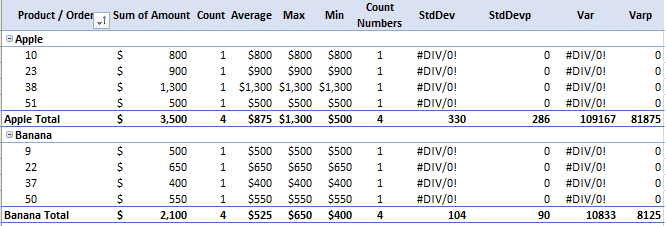
Calculations using the Value Field Settings
Excel will SUM PivotTable values automatically. But it can also Count, Average and so other calculations to your PivotTable. Even Standard Deviations can be included.
Rearranging Rows and columns
Now we get to the power of PivotTables that Microsoft loves to show in demonstrations. Moving the rows and columns around to show different views of the same information. We also look closely at the Fields pane which has a lot of options in a very cramped space.
Sorting PivotTable Fields
PivotTables can do a lot more than simply sort alphabetically or numerically. Make your own custom sort orders.
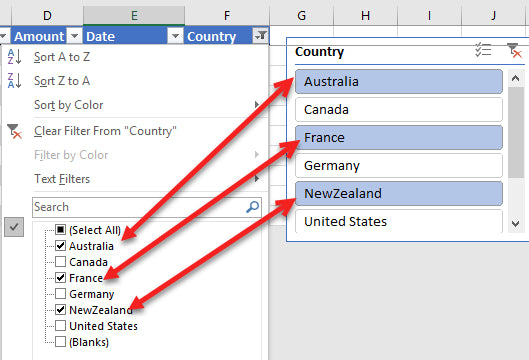
Filters
There's a lot to talk about with PivotTable filters. There are automatic filters (top sales by amount), filters by name (Coffee and Tea only) and even manual filters where you can select what to show or hide.
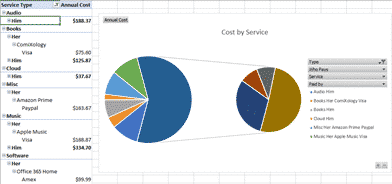
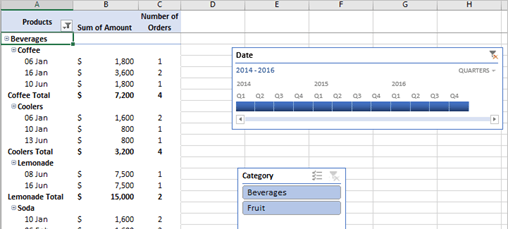
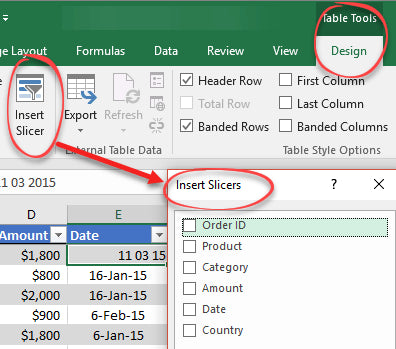
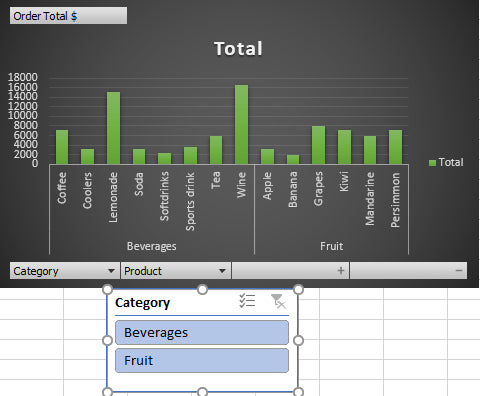
Excel Slicers
Slicers aren't magic! They might look like something fancy and difficult but they're definitely not. Slicers are really quite simple.

Connecting Slicers to multiple PivotTables
Even better, one or more Slicers can filter multiple PivotTables and PivotCharts.

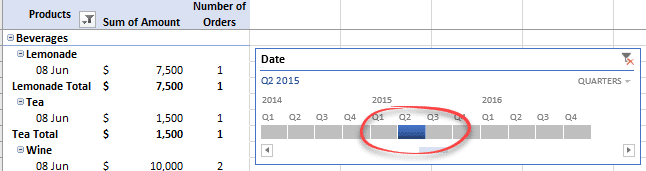
Timelines
Nothing too special about Timelines either. We'll show you that they're just Slicers for dates!

Slicer and Timeline together
Since Slicers and Timelines are basically the same thing, they can also be combined to filter your PivotTable, for example 'Show Coffee sales for January only'.

Formatting an Excel Slicer
The default Slicer is a little bland but you can make it look better.
Conditional Formatting in a PivotTable
Conditional Formatting isn't just about making a boring list look pretty. It's essential to quickly making sense of all the numbers. It's a simple way to 'red flag' unusual or out of range results that could be a problem.
Conditional Formatting Basics
Because Conditional Formatting isn't well understood, we've added an entire chapter on the subject. How it works, how it could work better.
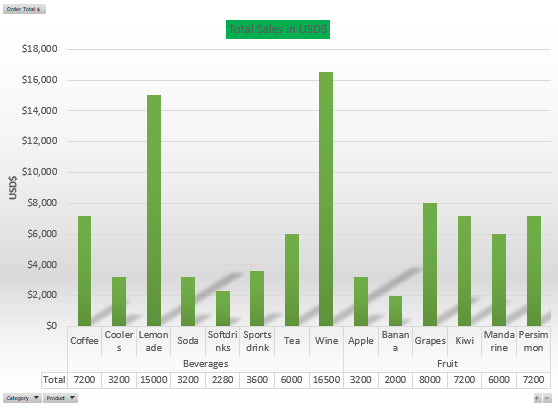
PivotCharts
PivotCharts are the natural extension of PivotTables. They have some tricks of their own, beyond what normal Charts can do.

We start with a simple first PivotChart 'from scratch' then how to make it look better than the Excel defaults.
Relationships and Data Models
Excel lists and tables can have relationships just like a 'real' database. Link some lists to make even better PivotTables. Use Data Models to speed up your workbooks with large or complex lists.
Subscriptions Manager
New! in the 2nd edition A complete working example of how to use PivotTables and PivotCharts in the real world. Subscriptions Manager workbook lets you organize your online plans (monthly, yearly etc.) like Netflix, HBO, Disney, Office 365 etc.

Plus a whole chapter about the Subscriptions Manager, how it works, customize it and change to suit you. A much enhanced version of the workbook on Office-Watch.com which has many extras:
- A broad category column to group subscriptions together.
- Two PivotTable/PivotChart combos.
- Dynamic Array examples with pull-down selectors.
- Make pull-down selector from a table column (not as easy as you'd expect).
- Improve and customize the Total row in Excel Tables.
Note: because of the features used, this workbook only works fully in Excel 365 for Windows or Mac.
Excel Tables
Tables are a lot more than pretty formatting. They're essential to making sure all of your list is included in a PivotTable. Excel 365, 2024, 2021, LTSC, 2019, 2016 & 2013 for Windows.
- <g>Gluten free
- Calorie controlled
- Low kilojoules
- Caffeine free
- 100% fat free
- Zero sugar
- No animal cruelty
- Dolphin friendly
- CFC free
- Not radioactive
- No asbestos </g>.